 Revela
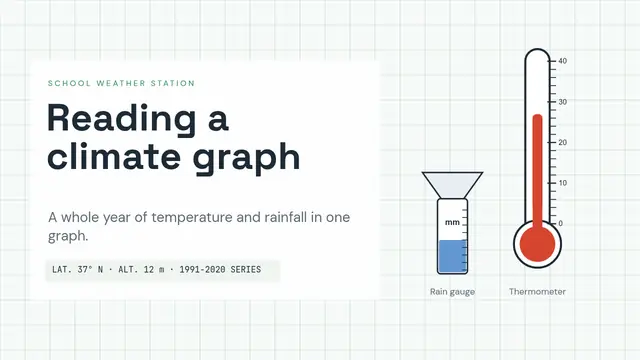
Reading a climograph
Weather station: a rising thermometer, bars with a line, table with formulas, equations, 3D satellite, matching and a countdown challenge.
- 8 slides
- Free, nothing to install
- Downloads as PowerPoint
What’s inside
How to use it
- Click Use this template: it opens in Revela, in your browser. Nothing to install.
- Replace the text, images and data with your own. The speaker notes tell you what to say on each slide.
- Present it with your phone as a remote, share it with a link or download it as PowerPoint.
More in Education
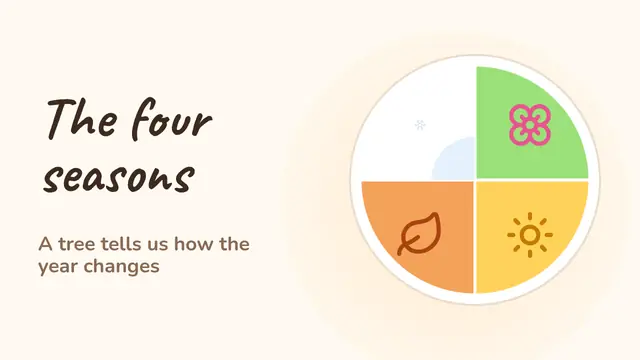 The four seasonsA tree that changes with Morph through four seasons, falling leaves and snow, a wheel of the year, a cycle, matching and a poll
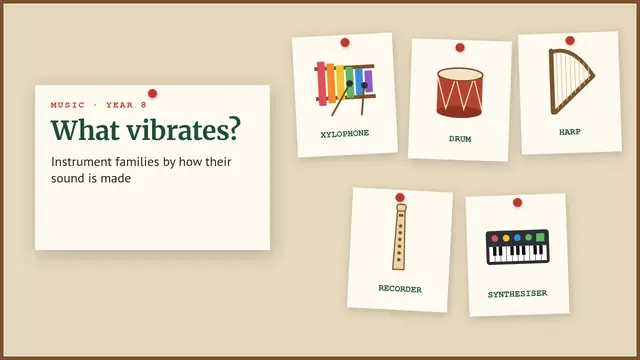 Instrument familiesCabinet of curiosities: pinned cards with drawings, a tree one by one, each family sounds, a playable piano, a scatter chart, a table and matching
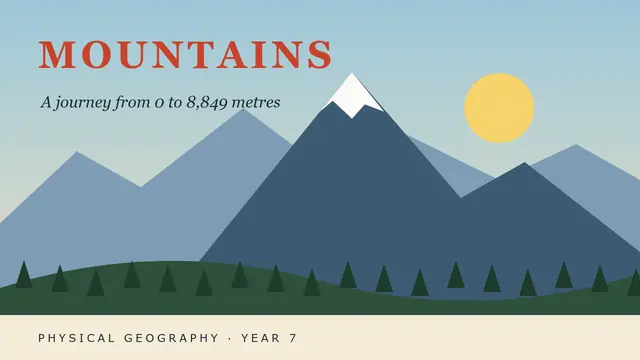 MountainsAlpine poster: landform parts one by one, temperature equation and table, vegetation belts as a pyramid, a climbing 3D hiker and ordering
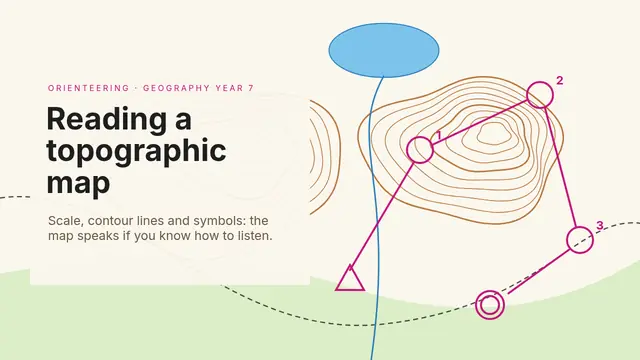 Reading a topographic mapOrienteering map: a course that draws itself, scale with an equation, table with formulas, contour lines with Transform and a 3D runner
 Farm animalsA drawn farm with its own animals, lines that draw themselves, a table that adds up, a moving 3D truck, a walking 3D fox, a quiz and labelling
 The five sensesCut-out cardboard: a drawn face, a radial diagram, riddles, buttons with five sounds, cards that flip, labelling and a countdown