 Revela
Statistics and probability
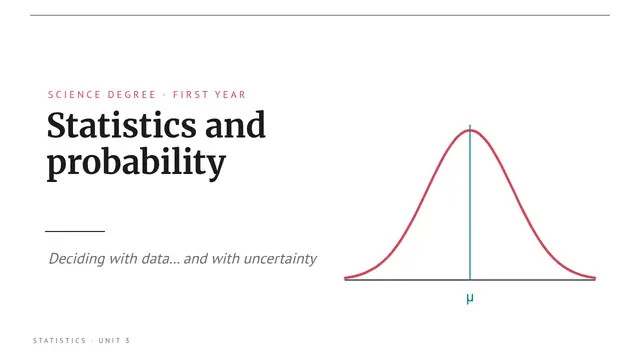
Editorial style: bell curve that draws itself, formulas, histogram, scatter, area, bar and bubble charts, and a scored question.
- 9 slides
- Free, nothing to install
- Downloads as PowerPoint
What’s inside
How to use it
- Click Use this template: it opens in Revela, in your browser. Nothing to install.
- Replace the text, images and data with your own. The speaker notes tell you what to say on each slide.
- Present it with your phone as a remote, share it with a link or download it as PowerPoint.
More in Science and university
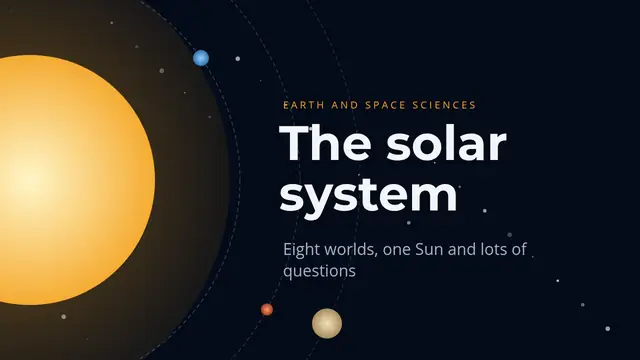 The solar systemPlanets to scale appearing in a chain, three 3D probes with different views and movements, table, radial diagram and matching
 Endocrinology: glucose and insulinGlucose sensor app style: phone with the screen, cycle one by one, curves, doughnut, table with formulas, equation, 3D avocado and poll
 Clinical trial: reading the resultsScientific journal style: CONSORT with connectors, survival curves, table with formulas, NNT, chained forest plot and quiz
 Pharmacokinetics: the half-lifeMedicine box style: a blister that fills up, LADME one by one, two-series curves, equations, table with formulas, code and fill in the gaps
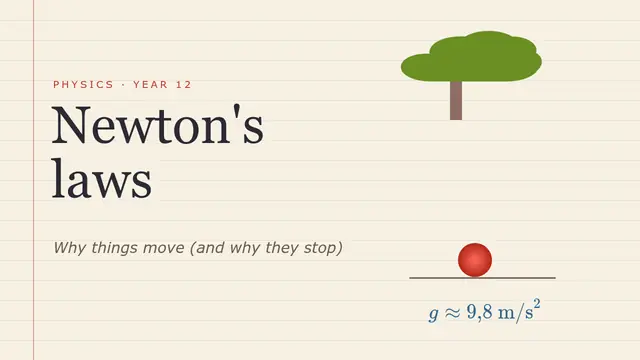 Physics: Newton's lawsPhysics notebook: equations, moving 3D car, projectile path that draws itself, table with formulas and fill in the gaps
 Renal physiology: the nephronBlueprint: a nephron that draws itself, a drop travelling it with sound, dimensions, waterfall, equation, table with formulas, 3D bottle and cycle