 Revela
What we throw away in Villa Cardo
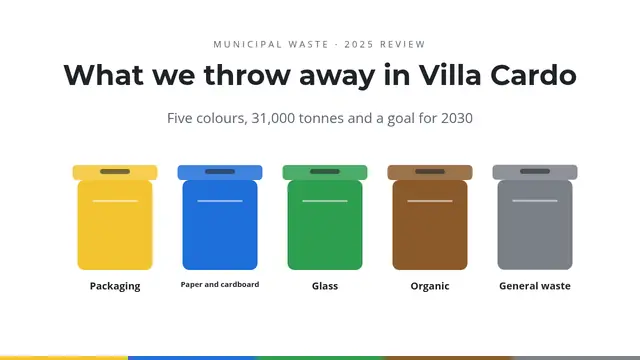
Bins that bounce with sound, giant figure, waterfall, stacked bars, colour-coded pie, funnel, matching and table.
- 9 slides
- Free, nothing to install
- Downloads as PowerPoint
What’s inside
How to use it
- Click Use this template: it opens in Revela, in your browser. Nothing to install.
- Replace the text, images and data with your own. The speaker notes tell you what to say on each slide.
- Present it with your phone as a remote, share it with a link or download it as PowerPoint.
More in Data
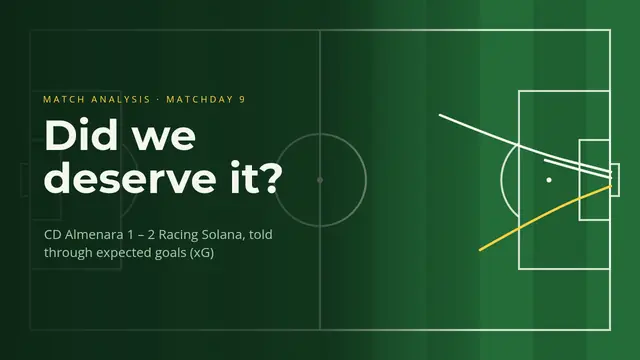 Expected goals (xG)Chalkboard on the grass: traced shots, scoreboard versus xG, shot map one by one, logistic equation, code, table and quiz
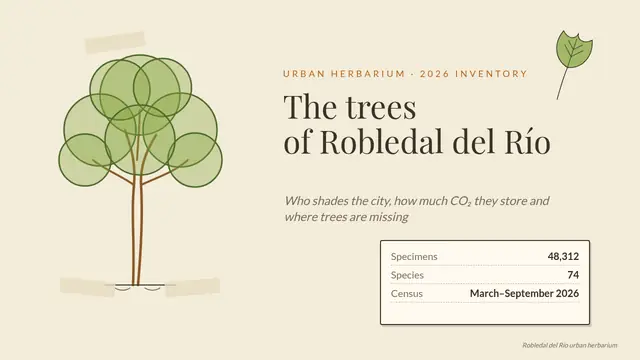 Urban tree inventoryHerbarium sheet: drawn tree, 3D plant with Morph, treemap, histogram, equation, table and matching
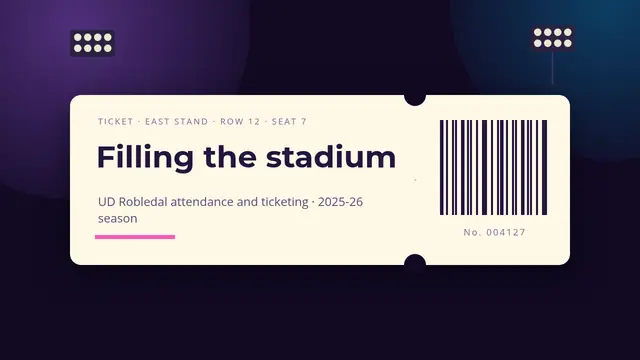 Filling the stadiumMatch ticket: stands by occupancy, area chart, two-series scatter, treemap, funnel, table with formulas, poll and 3D seat
 Marathon: what the finishes tell usRace-bib cover, figures with sound, finish-time histogram, the wall at km 30, a running 3D robot pacer, table with formulas and medal
 Web and marketing metricsKPIs with sparklines, four-series lines, areas, conversion funnel, combo chart and table with formulas
 Results dashboardDashboard style: gradient KPIs, waterfall, funnel, treemap and bubble charts, a table with automatic totals