 Revela
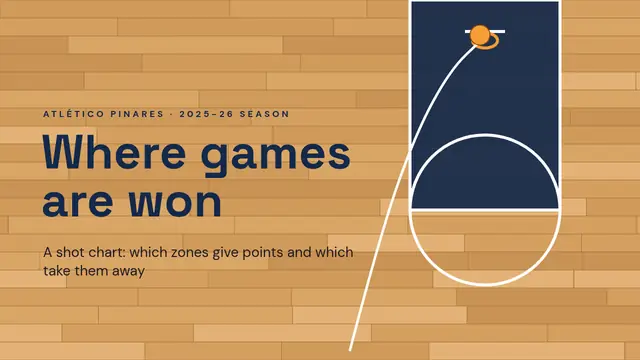
Where games are won: the shot chart
Wooden parquet: a traced shot, eFG equation, half court with zones by efficiency, 100% bars, crossing lines and quiz.
- 9 slides
- Free, nothing to install
- Downloads as PowerPoint
What’s inside
How to use it
- Click Use this template: it opens in Revela, in your browser. Nothing to install.
- Replace the text, images and data with your own. The speaker notes tell you what to say on each slide.
- Present it with your phone as a remote, share it with a link or download it as PowerPoint.
More in Data
 Stroke by stroke: 200 m freestylePool seen from above: a swimmer doing four lengths, equation, small multiples, stacked columns, table with formulas and word cloud
 Air quality in BrisamarA sky that clears with Morph, a needle gauge, equation, lines with gaps, radar, table with formulas and a rating
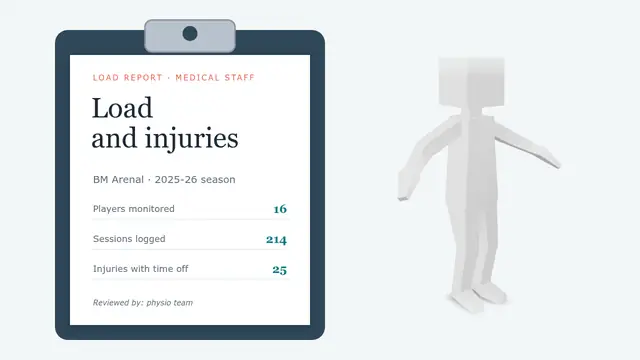 Training load and injuriesPhysio report: body map, ACWR equation with a moving marker, lines, stacked bars, code, table with formulas, cycle and 3D figure
 The water of FuentelindaA reservoir that empties with Morph, lines, doughnut, bars, tariff with equation and formulas, shower countdown
 The noise of SotoverdeA wave that rises by itself, decibel ruler with sounds, equation, noise map, stacked bars, quiz and countdown
 Elo: how strength is measuredNight-time board: 3D knight, equations, expected-score curve, step-by-step example, histogram, table with formulas, code and quiz