 Revela
Quarterly results in 3D icons
A company report with 3D icons and glass panels: key figures, revenue chart, milestones, teams, risks, priorities and conclusions; with sample data to replace with your own.
- 9 slides
- Free, nothing to install
- Downloads as PowerPoint
What’s inside
How to use it
- Click Use this template: it opens in Revela, in your browser. Nothing to install.
- Replace the text, images and data with your own. The speaker notes tell you what to say on each slide.
- Present it with your phone as a remote, share it with a link or download it as PowerPoint.
More in Feature catalogue
 Present like a proA cockpit: presenter view, notes, phone remote, laser pointer and ink, whiteboard, countdown and shortcuts
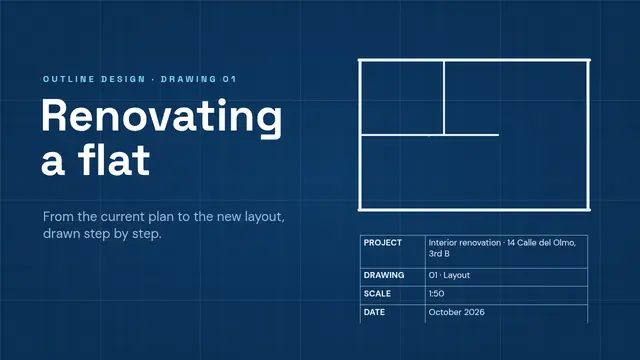 Flat renovation: the floor planA plan that draws itself: walls in a chain, dimensions, a demolished wall that disappears, Morph to the new layout, services and schedule
 Deliveries: roundabouts without scaresA 3D lorry that goes round the roundabout with turning wheels, a view from above with Morph, drawn signs, chart, table and ordering
 Tabletop role-playing: your first game3D characters with their animations: attack, block, cast spells and fall; walk up to the rival, a rolling die and health that drops
 Haiku workshop: word by wordAnimation by word and paragraph: lines word by word, a prompt phrase by phrase, counted syllables and Morph
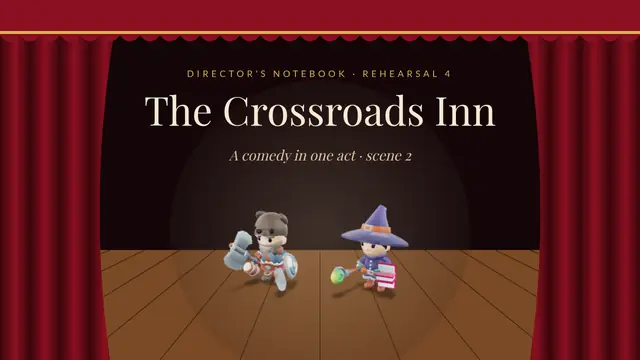 Theatre: rehearsing the scene3D characters going to their marks seen from above and, with Morph, from the stalls; lines with their gestures and a curtain