 Revela
Queen stage: the Alto de Peñaroja
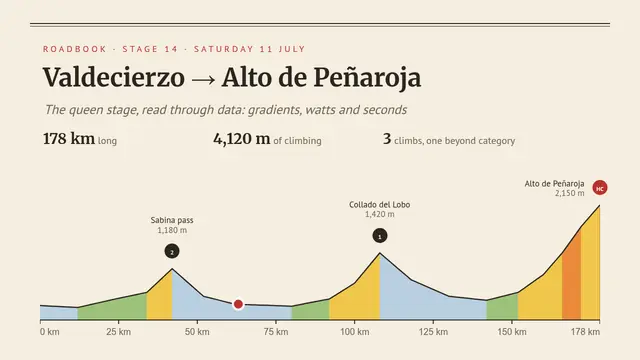
Roadbook: a coloured profile a rider climbs, climbs table with formulas, power equation, scatter, doughnut and 3D glasses.
- 9 slides
- Free, nothing to install
- Downloads as PowerPoint
What’s inside
How to use it
- Click Use this template: it opens in Revela, in your browser. Nothing to install.
- Replace the text, images and data with your own. The speaker notes tell you what to say on each slide.
- Present it with your phone as a remote, share it with a link or download it as PowerPoint.
More in Data
 Satisfaction surveyDoughnut with legend, compared radars, labelled columns, NPS, live rating and word cloud
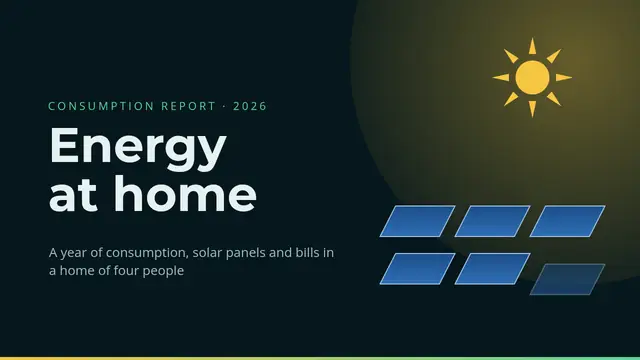 Energy and consumptionHourly stacked areas, three-series lines, treemap, labelled columns and calculated rate table
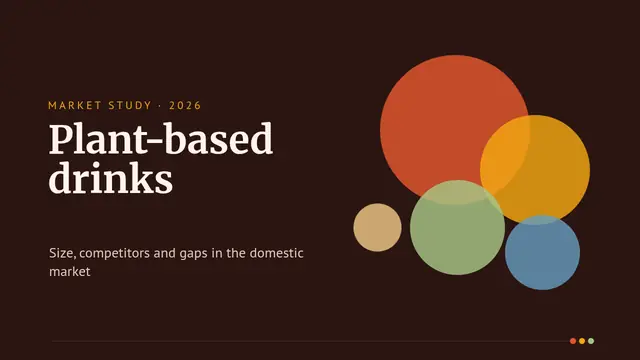 Market studyBig figures, treemap, bubbles, scatter plot, two-series horizontal bars and 2 × 2 matrix
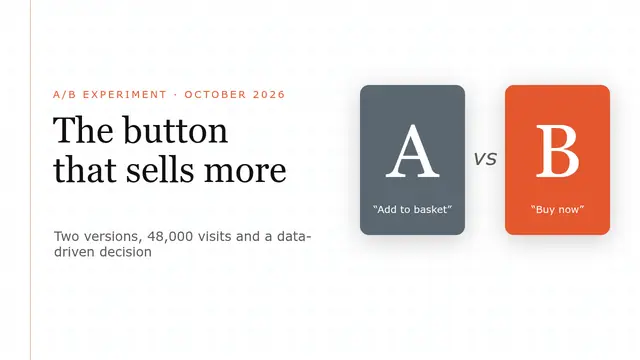 A/B experimentEquations, two-series scatter, labelled columns, conversion table with formulas and significance figures
 Personal financesWaterfall from salary to savings, pie chart, lines and area, tables with SUM, AVERAGE, MAX and MIN
 Expected goals (xG)Chalkboard on the grass: traced shots, scoreboard versus xG, shot map one by one, logistic equation, code, table and quiz