 Revela
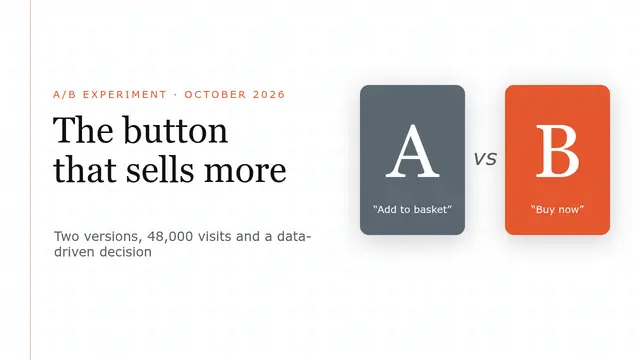
A/B experiment
Equations, two-series scatter, labelled columns, conversion table with formulas and significance figures.
- 8 slides
- Free, nothing to install
- Downloads as PowerPoint
What’s inside
How to use it
- Click Use this template: it opens in Revela, in your browser. Nothing to install.
- Replace the text, images and data with your own. The speaker notes tell you what to say on each slide.
- Present it with your phone as a remote, share it with a link or download it as PowerPoint.
More in Data
 Satisfaction surveyDoughnut with legend, compared radars, labelled columns, NPS, live rating and word cloud
 Energy and consumptionHourly stacked areas, three-series lines, treemap, labelled columns and calculated rate table
 Market studyBig figures, treemap, bubbles, scatter plot, two-series horizontal bars and 2 × 2 matrix
 Personal financesWaterfall from salary to savings, pie chart, lines and area, tables with SUM, AVERAGE, MAX and MIN
 Web and marketing metricsKPIs with sparklines, four-series lines, areas, conversion funnel, combo chart and table with formulas
 Results dashboardDashboard style: gradient KPIs, waterfall, funnel, treemap and bubble charts, a table with automatic totals