 Revela
Data: Free presentation templates
31 sample presentations with their own design and content, from a history lesson to an investor pitch. Open them in your browser, change them and present them.
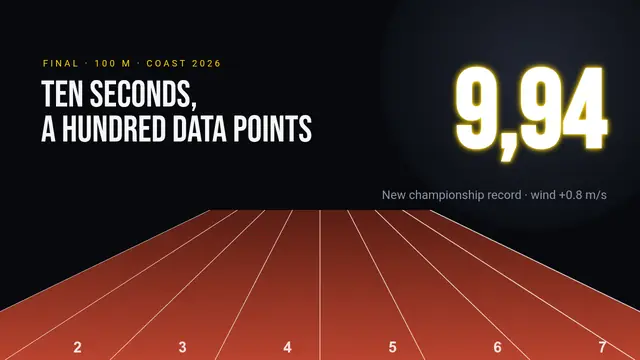 100 metres in 9.94 secondsStadium at night: neon time, phases as chevrons, speed every 10 m, table with formulas, photo finish, 3D watch and countdown
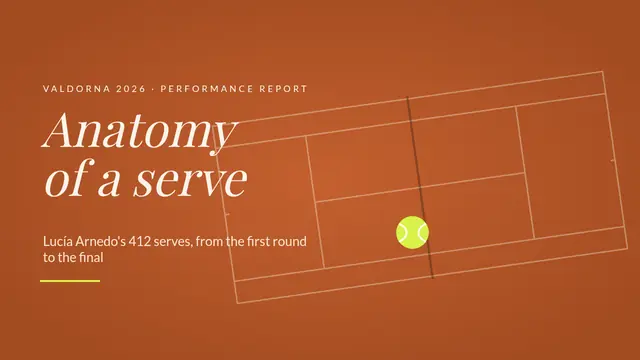 Anatomy of a serveClay court: a bouncing ball, serves on the court and a zoom into the box with Morph, radar, 100% bars, equation and poll
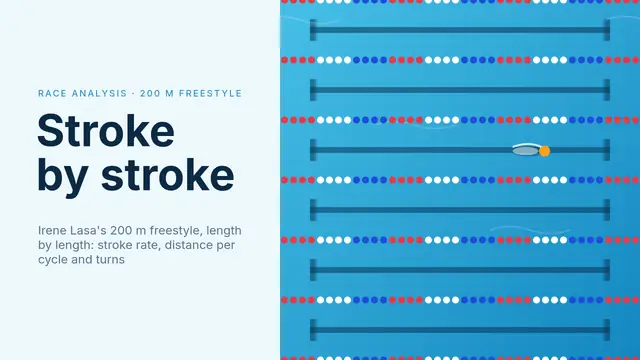 Stroke by stroke: 200 m freestylePool seen from above: a swimmer doing four lengths, equation, small multiples, stacked columns, table with formulas and word cloud
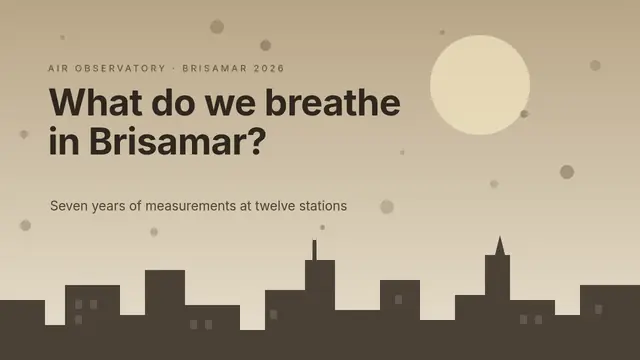 Air quality in BrisamarA sky that clears with Morph, a needle gauge, equation, lines with gaps, radar, table with formulas and a rating
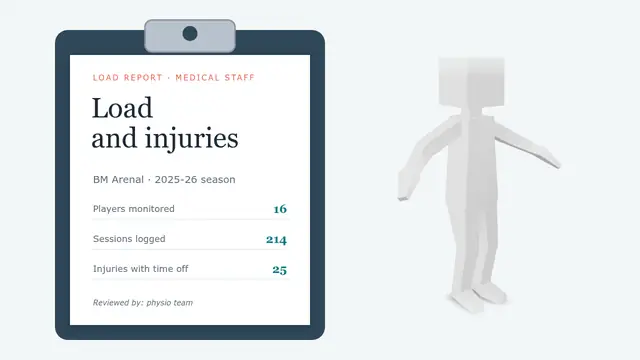 Training load and injuriesPhysio report: body map, ACWR equation with a moving marker, lines, stacked bars, code, table with formulas, cycle and 3D figure
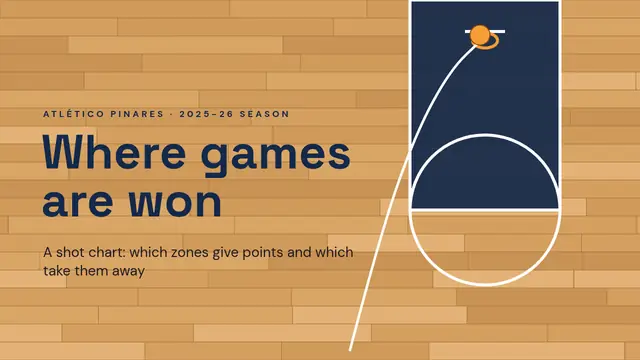 Where games are won: the shot chartWooden parquet: a traced shot, eFG equation, half court with zones by efficiency, 100% bars, crossing lines and quiz
 The water of FuentelindaA reservoir that empties with Morph, lines, doughnut, bars, tariff with equation and formulas, shower countdown
 The noise of SotoverdeA wave that rises by itself, decibel ruler with sounds, equation, noise map, stacked bars, quiz and countdown
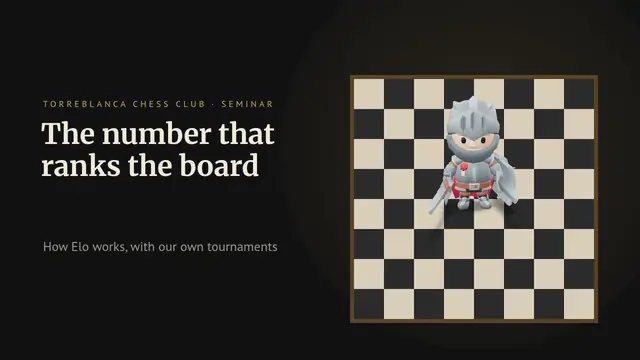 Elo: how strength is measuredNight-time board: 3D knight, equations, expected-score curve, step-by-step example, histogram, table with formulas, code and quiz
 Satisfaction surveyDoughnut with legend, compared radars, labelled columns, NPS, live rating and word cloud
 Energy and consumptionHourly stacked areas, three-series lines, treemap, labelled columns and calculated rate table
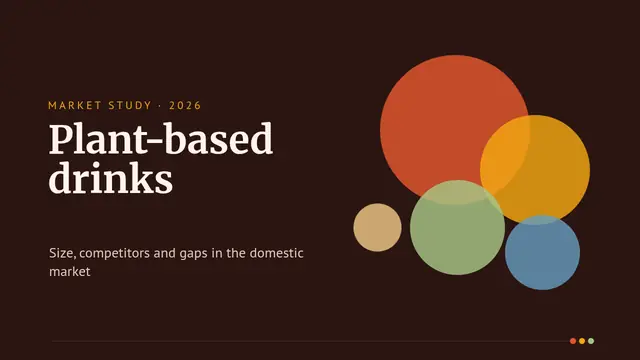 Market studyBig figures, treemap, bubbles, scatter plot, two-series horizontal bars and 2 × 2 matrix
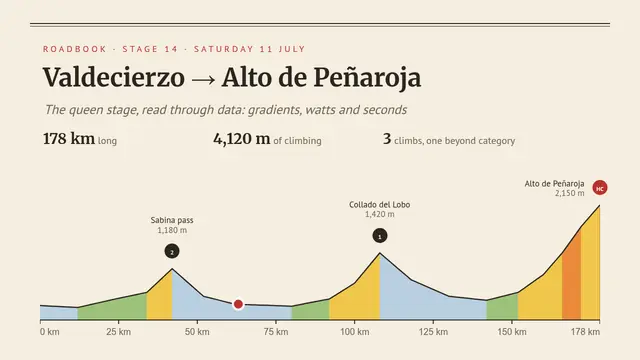 Queen stage: the Alto de PeñarojaRoadbook: a coloured profile a rider climbs, climbs table with formulas, power equation, scatter, doughnut and 3D glasses
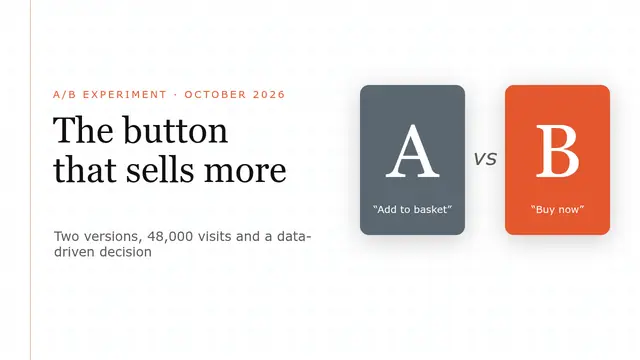 A/B experimentEquations, two-series scatter, labelled columns, conversion table with formulas and significance figures
 Personal financesWaterfall from salary to savings, pie chart, lines and area, tables with SUM, AVERAGE, MAX and MIN
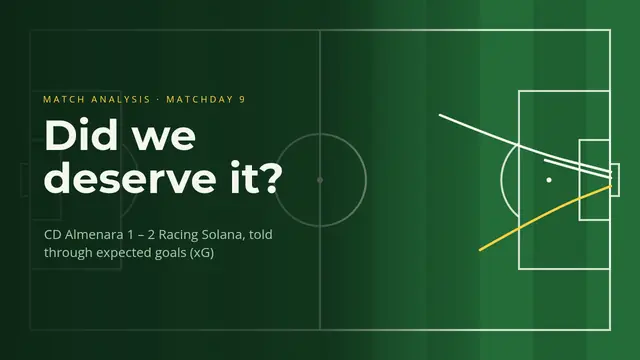 Expected goals (xG)Chalkboard on the grass: traced shots, scoreboard versus xG, shot map one by one, logistic equation, code, table and quiz
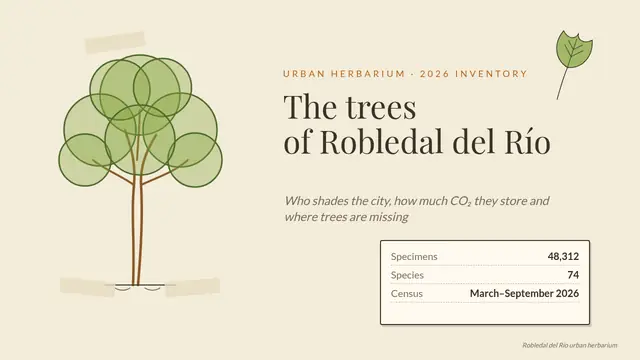 Urban tree inventoryHerbarium sheet: drawn tree, 3D plant with Morph, treemap, histogram, equation, table and matching
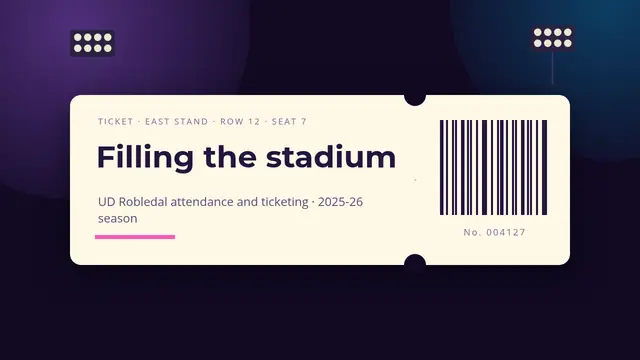 Filling the stadiumMatch ticket: stands by occupancy, area chart, two-series scatter, treemap, funnel, table with formulas, poll and 3D seat
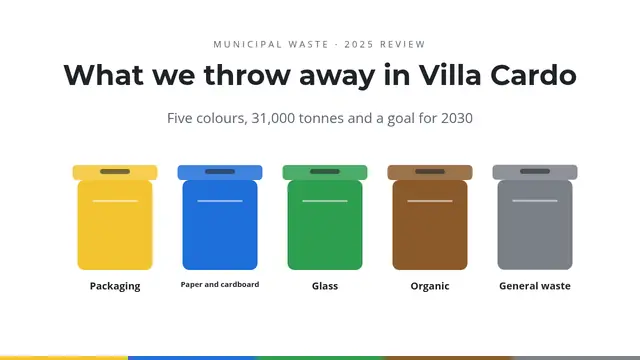 What we throw away in Villa CardoBins that bounce with sound, giant figure, waterfall, stacked bars, colour-coded pie, funnel, matching and table
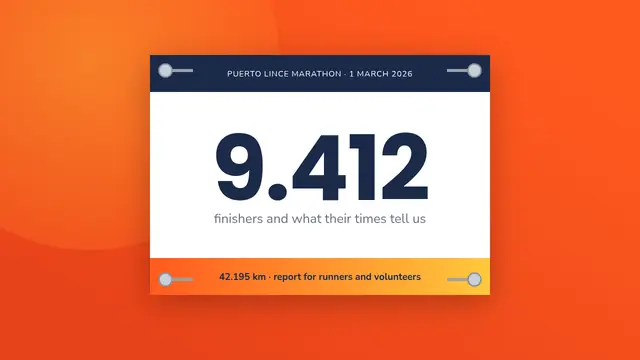 Marathon: what the finishes tell usRace-bib cover, figures with sound, finish-time histogram, the wall at km 30, a running 3D robot pacer, table with formulas and medal
 Web and marketing metricsKPIs with sparklines, four-series lines, areas, conversion funnel, combo chart and table with formulas
 Results dashboardDashboard style: gradient KPIs, waterfall, funnel, treemap and bubble charts, a table with automatic totals
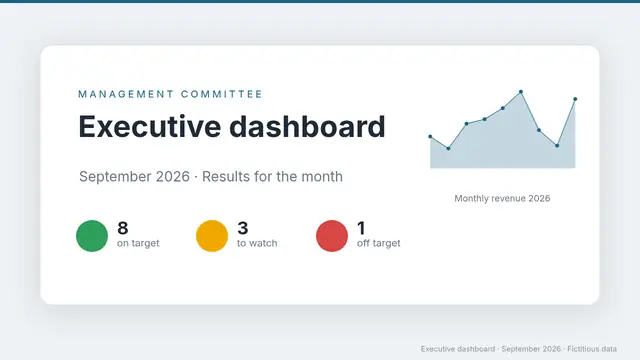 Monthly executive dashboardKPIs with traffic lights and sparklines, combo chart against budget, small multiples, doughnut and poll
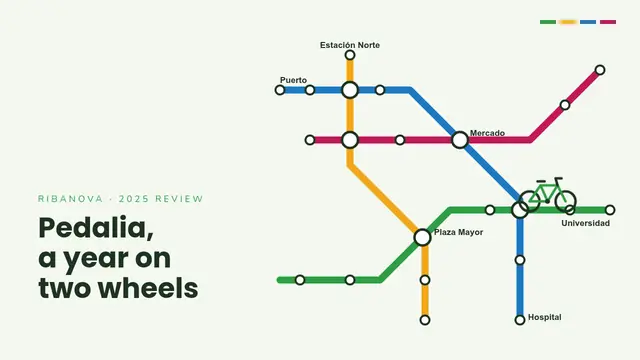 Pedalia: a year of bike sharingMetro-style map, a bike that rides a line, figures with sound, lines, stacked bars, app on a phone, table and code
 Population and demographicsPopulation pyramid, histogram, horizontal bars, crossing lines and indicator table with formulas
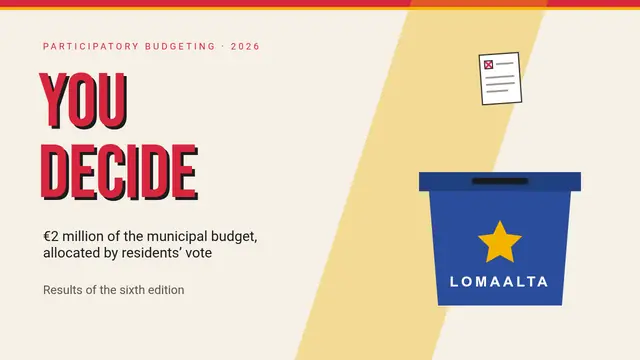 Participatory budgetCivic poster: ballot box with falling ballots, doughnut, chevrons, combo chart, results with a drumroll, table with formulas
 The season in numbersGiant figures with sound, league table with formulas, negative bars, lines, stacked bars and team radar
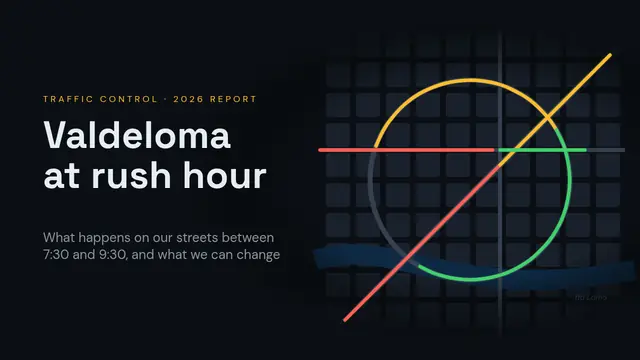 Rush-hour trafficNight control room: map with traced jams, a traffic light that lights up, heat table, Webster's formula, code and a 3D truck
 Tourism on Isla MarenaTravel poster: sun with curved text, pictogram, area chart, treemap, 100 % bars, 3D walker, table and postcard
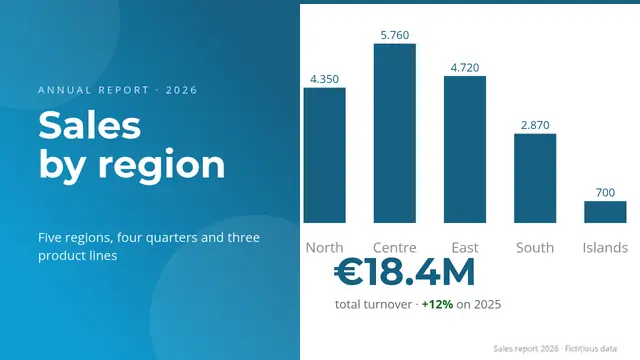 Sales by regionGrouped, stacked and 100 % bars, combo chart with target, table with formula totals and animated KPIs
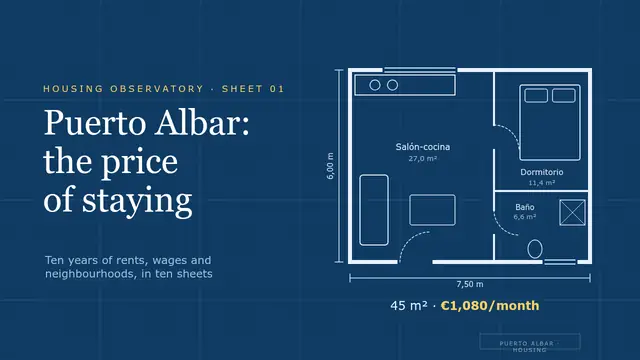 Housing: the price of stayingArchitect's drawing: SVG floor plan, areas to scale, combo chart, equation, table with formulas, scatter and a 3D sofa