 Revela
Health indicators of a neighbourhood
Reading public health indicators of an invented neighbourhood: life expectancy, rates per 1,000, age pyramid, differences between neighbourhoods and how this data is used to decide where to put a health centre.
- 10 slides
- Free, nothing to install
- Downloads as PowerPoint
What’s inside
How to use it
- Click Use this template: it opens in Revela, in your browser. Nothing to install.
- Replace the text, images and data with your own. The speaker notes tell you what to say on each slide.
- Present it with your phone as a remote, share it with a link or download it as PowerPoint.
More in Data
 Personal financesWaterfall from salary to savings, pie chart, lines and area, tables with SUM, AVERAGE, MAX and MIN
 Expected goals (xG)Chalkboard on the grass: traced shots, scoreboard versus xG, shot map one by one, logistic equation, code, table and quiz
 Charts that misleadHow a chart can say the opposite of the data: truncated axes, manipulated scales, misleading areas, impossible pie charts and percentages with no base, with examples to fix and a checklist
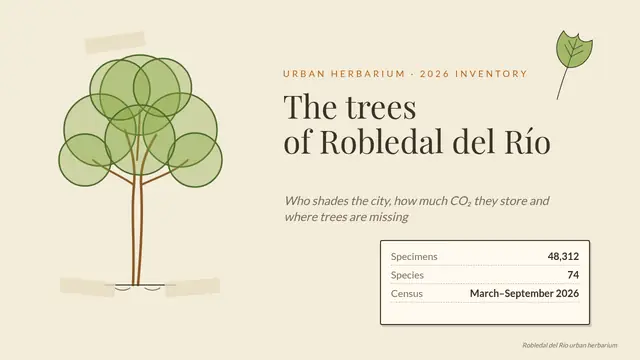 Urban tree inventoryHerbarium sheet: drawn tree, 3D plant with Morph, treemap, histogram, equation, table and matching
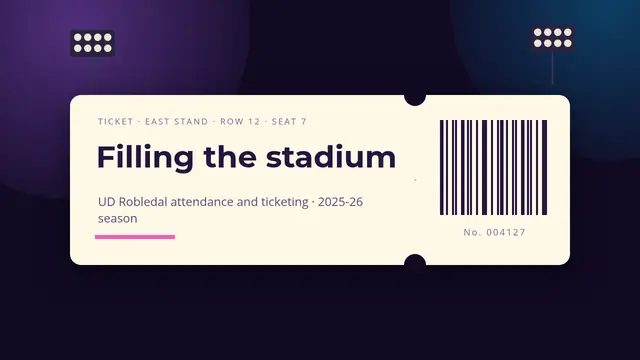 Filling the stadiumMatch ticket: stands by occupancy, area chart, two-series scatter, treemap, funnel, table with formulas, poll and 3D seat
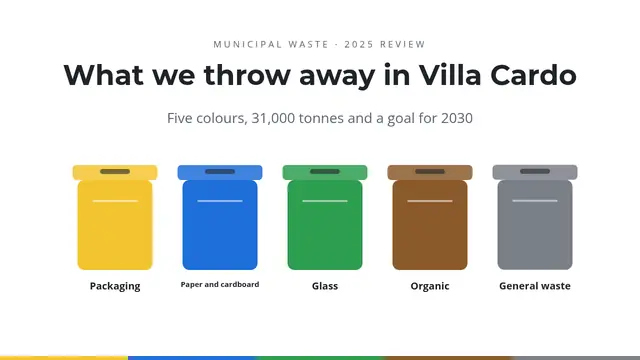 What we throw away in Villa CardoBins that bounce with sound, giant figure, waterfall, stacked bars, colour-coded pie, funnel, matching and table